

Google's Chrome UX Report (CrUX), as its name implies, provides valuable insights into whether a website is user-friendly. To that end, it evaluates several UX and performance metrics that Google uses as ranking factors. In this article, we'll discuss what CrUX is and how to optimize your SEO.
What is Google's Chrome User Experience Report?
Google's Chrome UX Report or CrUX is a public data set of user experience metrics that reveal real-world Chrome users' experiences across millions of sites. Google collects this data from users who have opted to participate in the study, and this is how it measures website speed. It's the perfect tool to understand how the Search Engine giant sees your web performance.
What metrics can you see in the CrUX?
The CrUX measures the Core Web Vitals and other key data sets related to UX. For example, it displays the data from phone and desktop devices and the types of connections they use.
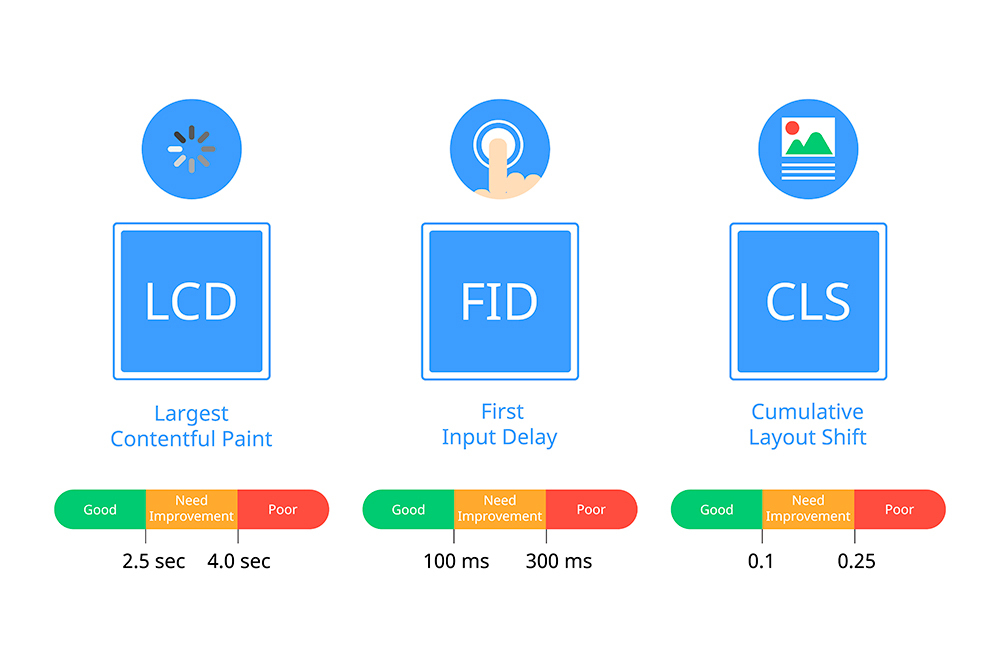
The web vitals measured by CrUX are:
- Largest Contentful Paint (LCP)
- First Input Delay (FID)
- Cumulative Layout Shift (CLS)
- Time to First Byte (TTFB)
- First Contentful Paint (FCP)
We've covered the Core Web Vitals metrics before in another post, so please take a look at it if you are interested.
CrUX metric performance
We are fortunate that Google not only measures and evaluates the UX but also clearly shows us the score based on whether it considers it good, in need of improvement, or poor.
According to Google's score, the following is an example of the Core Web Vitals status.
How to use Google's Chrome User Experience Report
The quickest way to check Google's Chrome User Experience Report data is by accessing the CrUX Dashboard or PageSpeed Insights. If you have technical skills, you can also use Google BigQuery to gain deeper insights from the CrUX report. Also, there's the CrUX API available for those who want to integrate it with other applications.
CrUX Dashboard
The CrUX dashboard is an open-source tool that works via Google Data Studio. The data is sourced from the BigQuery dataset, but you don't need to write SQL to extract the data. You can see a history of the UX extracted from the performance metrics through the dashboard.
To create the dashboard, go to the CrUX community connector page. If you are a first-time user, first complete your account setup.
Introduce the original URL data. (Please note that the text input field only accepts origins, not full URLs).
Example:
- Origin (Supported): https://befast.com
- URL (Not supported): https://befast.com/blog/chrome-user-experience-report/
Remember to provide the correct protocol HTTP or HTTPS. If your site has a redirect, let's say from http:// to https://, you'll need to introduce the last one.
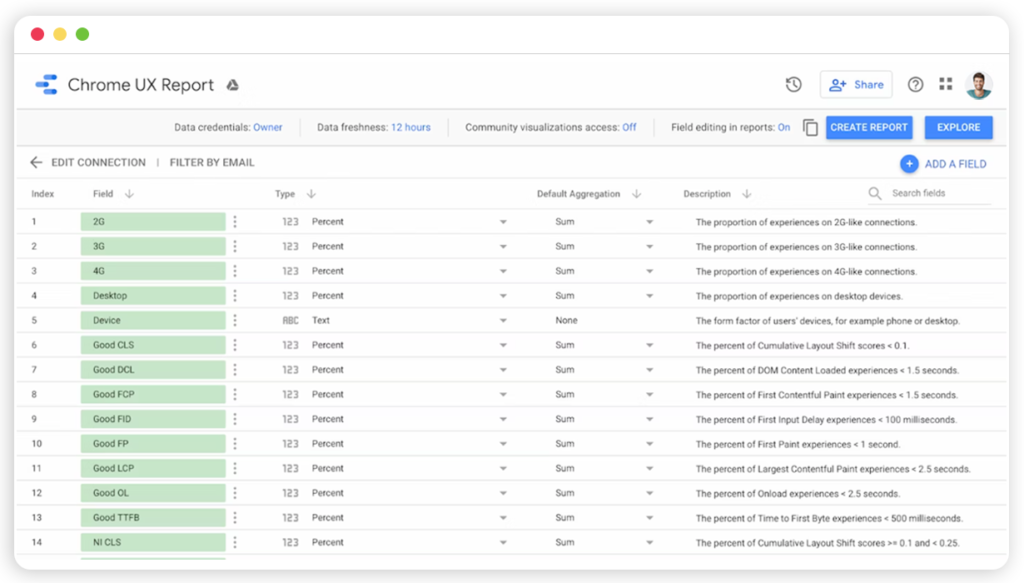
If the origin exists, the schema page for the dashboard will open, and you'll see all data fields (connection type, factor, month of dataset release). Click on Create Report.
What can you see on the dashboard?
You'll find three types of pages on your dashboard. These are monthly datasets released on the second Tuesday of every month.
- Core Web Vitals Overview
- Metric performance
- User demographics
You can refresh the dashboard to get the latest data.
Page Speed Insights
Using PageSpeed Insights (PSI), you'll see the site performance results distributed by desktop and mobile users.
To use the tool, you only need to enter the URL in the search box and click analyze. You'll immediately see the diagnosis of your site performance with actionable recommendations to optimize it.
CrUX Report limitations
As you have seen, the CrUX report is a great tool to examine if your site is sufficiently user-friendly. However, it comes with some limitations that you should be aware of.
- Since Google only returns anonymized aggregate data if you have a low-traffic site, you may get a “Chrome UX report data not found” or “no data” message.
- It does not specify your performance by individual pages or segments.
- A new browser release may lead to changes in data.
- The data you receive is exclusively from people using Chrome and does not reflect results from other browsers.
- The CrUX dashboard only provides data at a global level, and you cannot zoom in on specific countries. To do this, you need the BigQuery dataset.
- The CrUX dashboard, based on BigQuery, is restricted to origin-level data at monthly granularity.
CrUX and Monitoring tool
Befast is a page speed testing tool that allows you to check the CrUX metrics results while addressing its limitations. You'll be able to see the history of Core Web Vitals' performance, make comparisons between pages, and monitor site speed metrics 24/7. Obtain real-time data and create custom segmentation to obtain in-depth audits.